Case study • October 18, 2024
Everything You Need to Know About Qualivilles Statistics
This article has been viewed 29 times

In an environment where data management is crucial for local authorities, Maarch Courrier stands out as an essential tool for tracking performance indicators.
By incorporating data centralization tools, Maarch Courrier gives municipalities the ability to view and analyze their data in real time, helping to optimize their mail management processes.
As a result, Maarch Courrier SaaS clients automatically benefit from this feature.
What is the Qualivilles certification?
Qualivilles is a certification framework established by AFNOR, covering the quality of citizen relations (residents’ day-to-day interactions with municipal services). This certification is aimed at local government stakeholders.
The main goals of this framework are to improve user satisfaction, optimize services, and showcase the expertise of municipal staff. It consists of service commitments that help structure quality-management policy around welcoming residents, providing information, guidance, and responses to their requests.
Essential features available to Maarch Courrier clients
With these dashboards, you can:
- View mail statistics: get an overview of mail performance.
- Track acknowledgment-of-receipt sending times: improve communication by monitoring these delays.
- Analyze processing-time statistics: assess the efficiency of mail processing.
- Gain insights into platform usage: understand how the platform is used by staff in order to optimize its efficiency.
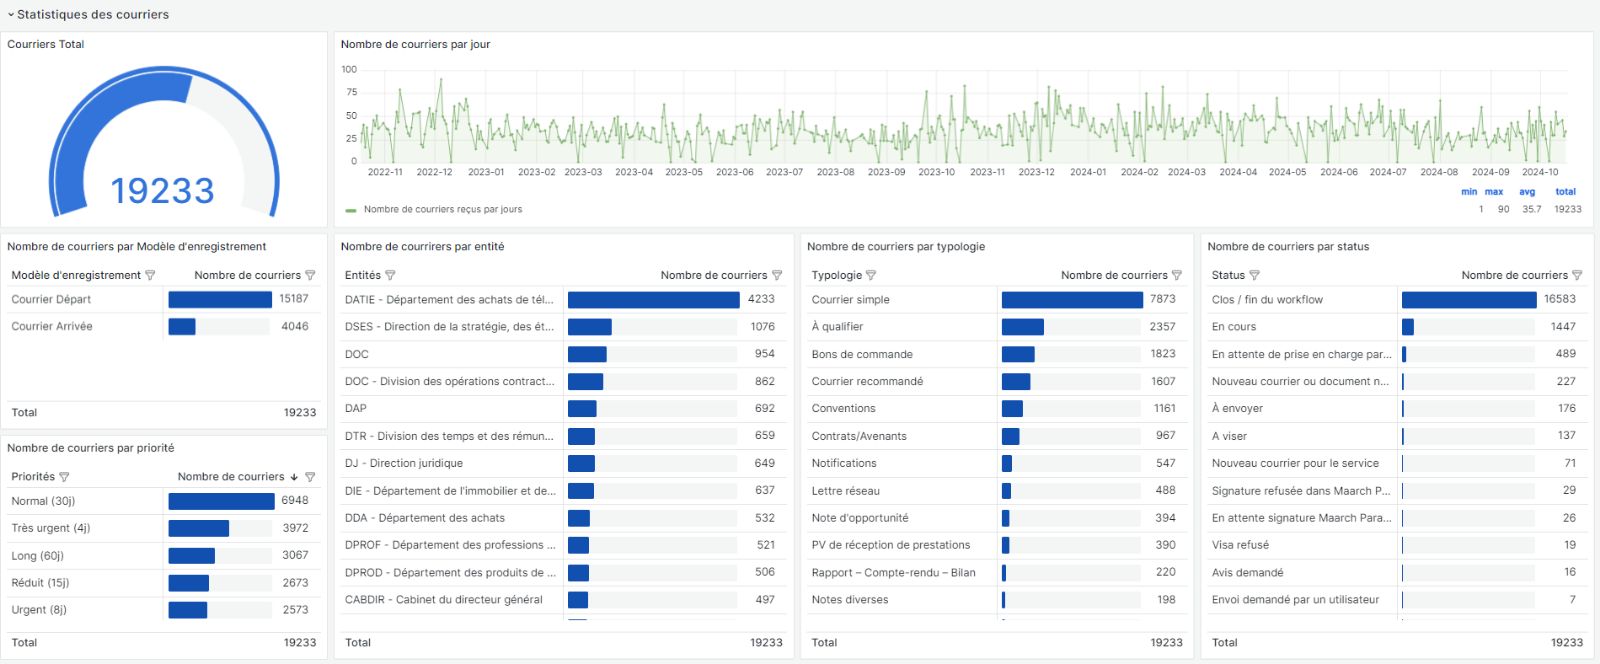
Mail statistics
Among its indicators are those used to track the service quality criteria covered by the Qualivilles certification:
- Mail processing time
- Response times
- Volume of pending mail
- Breakdown of requests by department or topic
- Average volume of mail processed per staff member
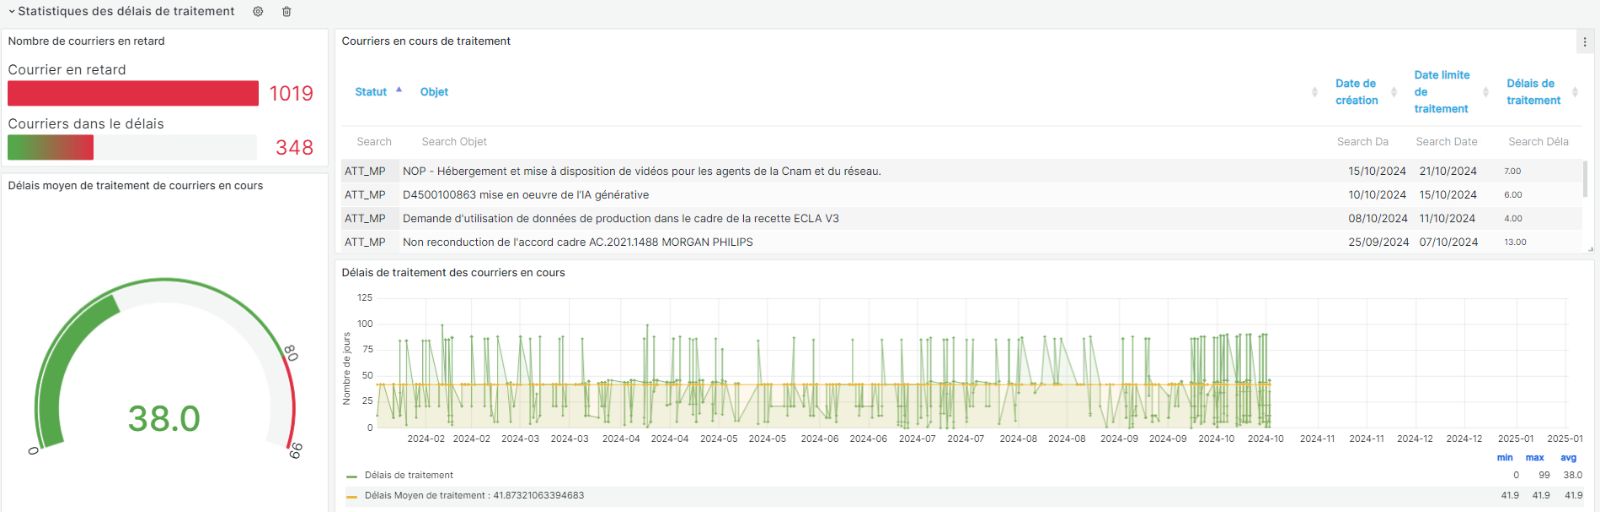
Processing time statistics
Dashboard examples
The flexibility and customization of dashboards and charts (such as pie charts, line charts, gauges, etc.) make it easier to understand the data presented.
This makes it possible to quickly identify trends in citizen requests and make informed decisions based on statistical analysis.
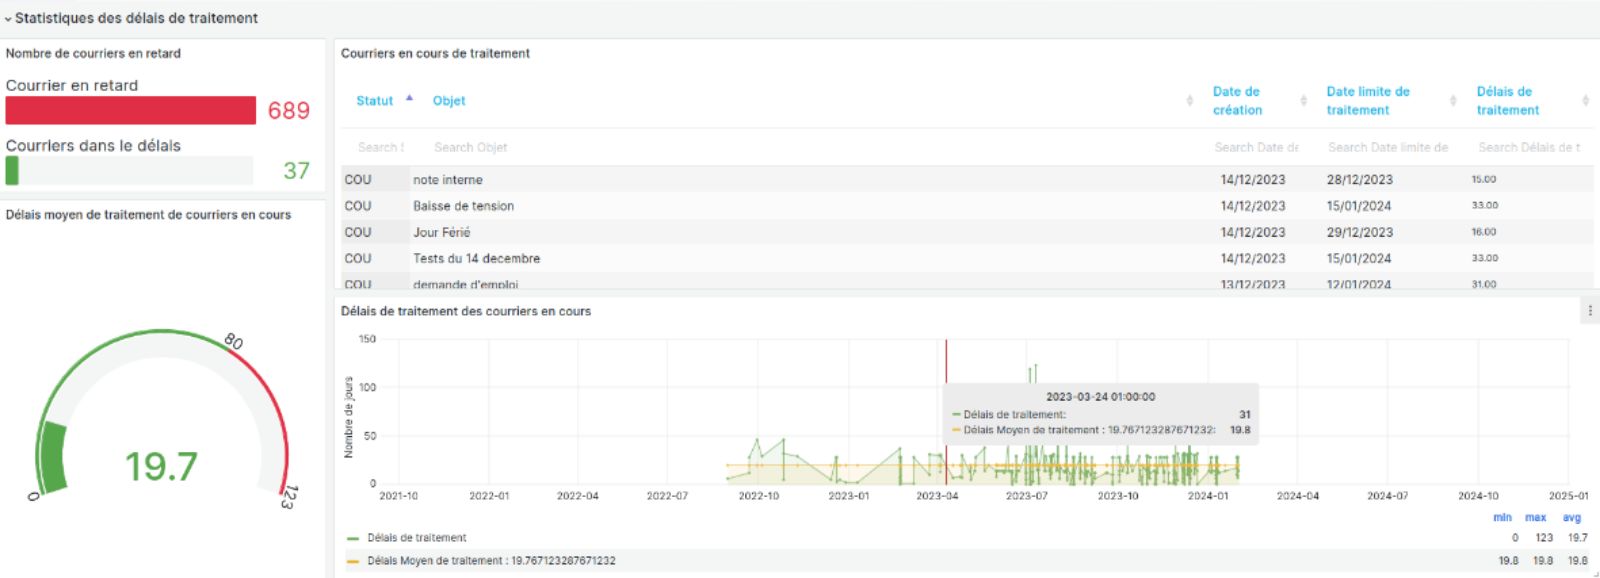
Mail currently being processed (line chart dashboard)
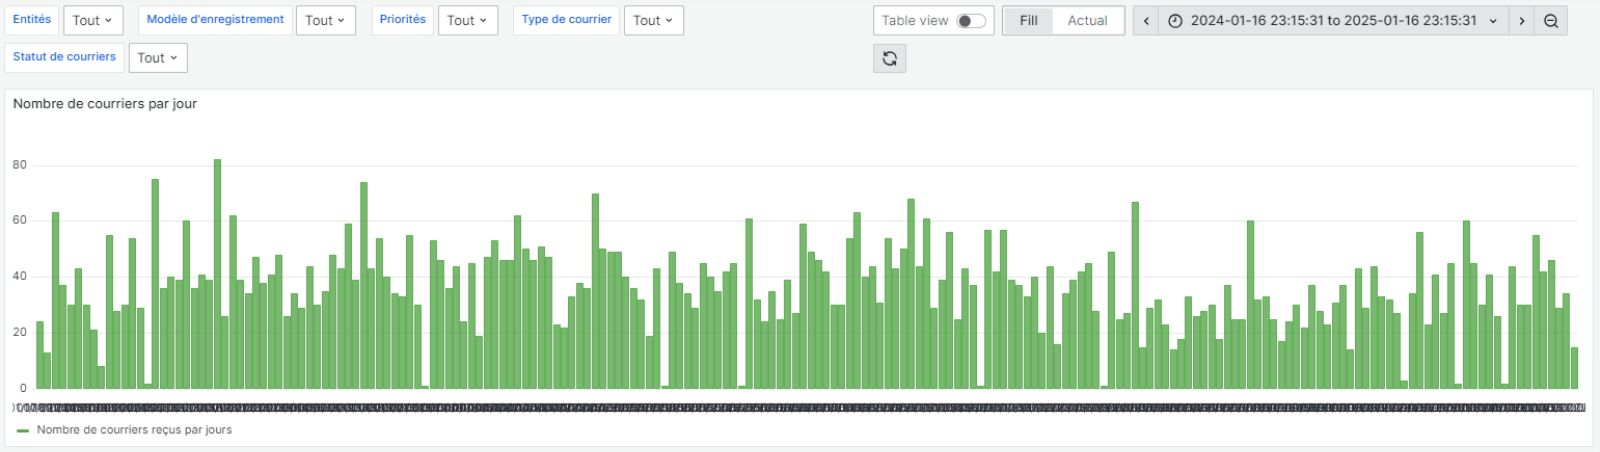
Number of mail items received per day (bar chart)
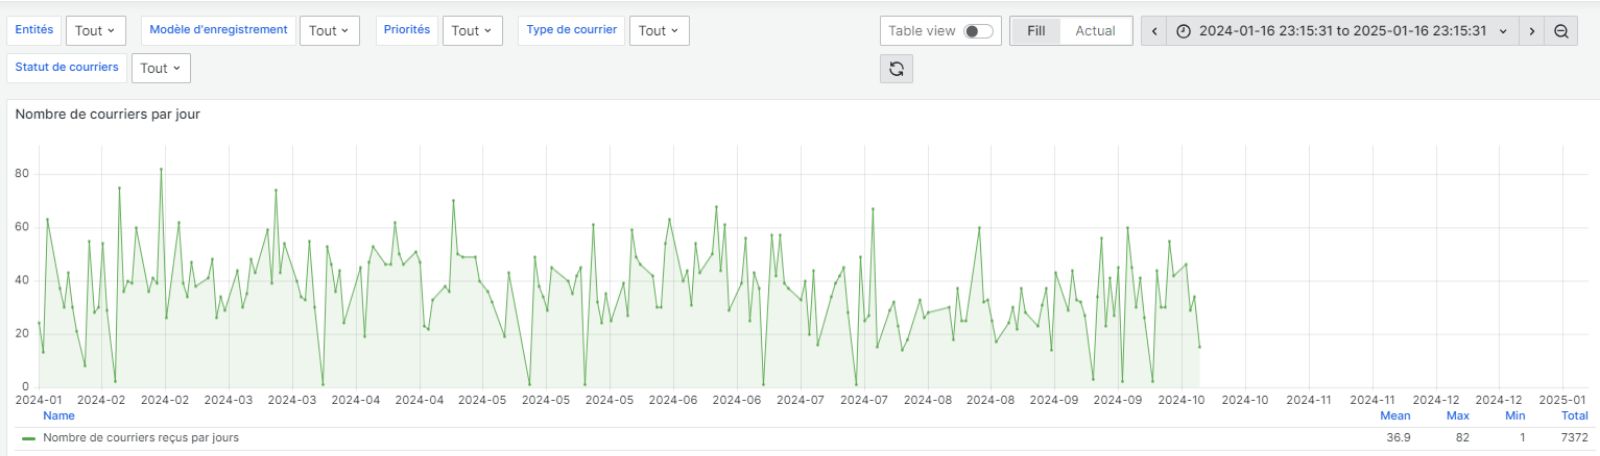
Number of mail items received per day (line view)
Thanks to intuitive queries, users can extract the information they need quickly and easily, which improves overall understanding of the data. This allows them to better analyze their performance and adjust their actions accordingly, contributing to more informed and optimized management.
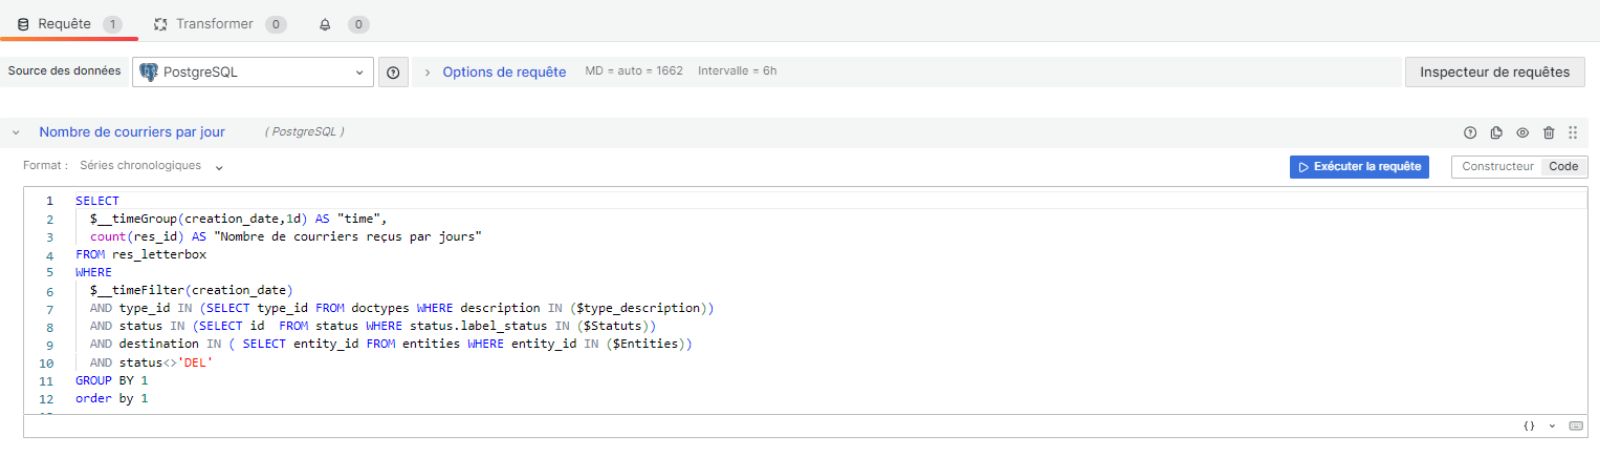
Number of mail items received per day (line view)
It is also possible to refine searches using filters such as the entity associated with different departments, the registration template, the priority level, or the type or status of mail. This makes it possible to highlight specific data and easily extract relevant information.
This feature improves data readability and enables faster, more targeted decision-making.
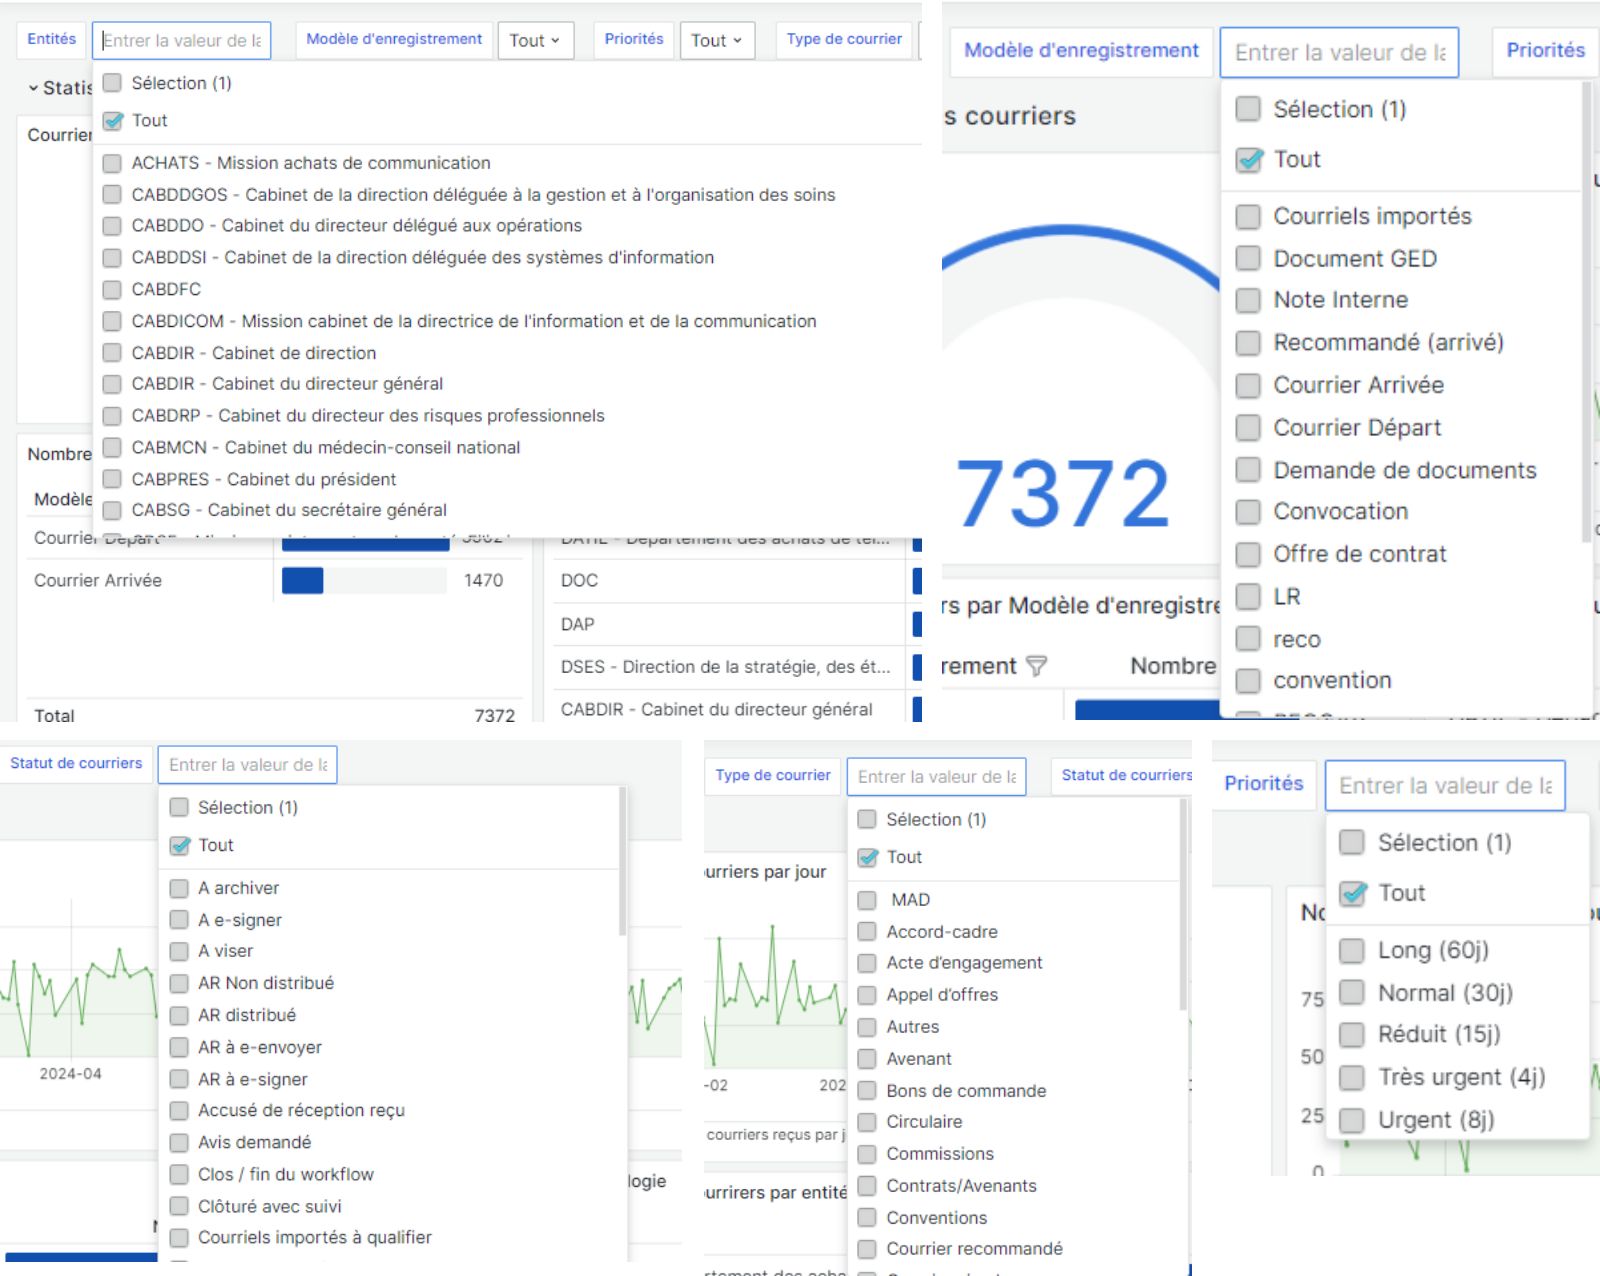
Example of available filters
To strengthen transparency and collaboration between departments, users can easily generate and share their dashboards, either by exporting them or by granting secure access to their staff.
As a result, each staff member can access key information in real time, improving coordination and departmental efficiency.

Export the dashboard
Results achieved
After four months of use, some of our clients using Maarch Courrier were able to adjust their correspondence policy and successfully reduced mail processing time by 30%.
In addition, their citizen satisfaction rate increased by around 20%.
Mail management managers believe this feature has allowed them to adjust their working methods and get a clearer view of key indicators.
In conclusion
Maarch Courrier helps you optimize your mail management while improving the responsiveness and efficiency of your services toward citizens. Going forward, some of our clients, both public and private, plan to use this statistical analysis tool more frequently to boost their performance.
Please note that all of these features are made available via Grafana for our On-Premise clients.
The combination of these two open-source, free software solutions gives you everything you need to make the most of your data! Why wait? Start analyzing your electronic mail management (GEC) statistics with Maarch Courrier today.
Maarch Courrier and Grafana documentation
To learn more about these features, check out the links below:
https://docs.maarch.org/MaarchCourrier/guat/guat_exploitation/docker-grafana.html
https://grafana.com/docs/grafana/latest/setup-grafana/installation/docker/
Dive deeper into the Maarch ecosystem







Choose the open-source reference
More than 100,000 users already trust us!